
OK, one is about beer and one is an alien attack... but which is which?
Boak and Bailey got me thinking with this graphical representation of data. In this case it was a five point illustration of a variety of imperial stouts. You will immediately see a most interesting point being asserted. Tsar Top and Sam Smith have beers that overlap less than 50% in this diagram. Yet both are suggested and likely marketed to be of a kind. So, either the graph is miscalibrated or, more likely, kind and class are fools' errands when considering continuums like good beer, so much of which can now be considered of that one "international style."
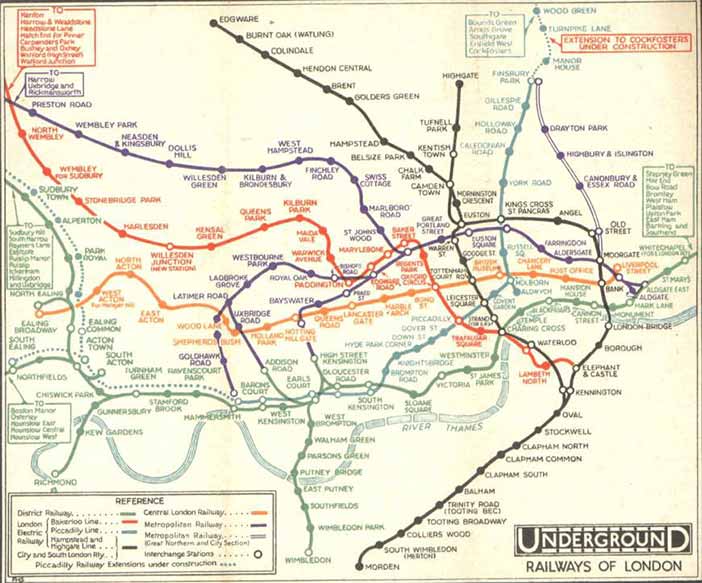
Graphs are great. So much more useful that words. Ethan referenced the Beeriodic Table, dubbed by Martyn as fatally flawed. Even so, it is a useful analogy and one that conveys the seriousness and authority of chemistry even if good beer has no such scientific solidity. There must be different diagrams, however, that are more familiar to us that better represent the themes, interconnections and wandering ways of the results of brewers' work. The most obvious that comes to my mind is the famous London Underground map. The ordered, stylized, schematic diagram of Harry Beck's, first dating from 1933, replacing something more realistically organic. With its maze of interconnections, the expanding reach of the system out into new territories overtime as well as the familial patterns expressed in colour and location it is a great model upon which the full expression of all good beer could be overlaid.
Now, just if I could find the time to do it...